Custom reports and graphical trending in QEdge
By QEdge Team
Published On September 11, 2017
Real time reporting with custom reports and graphics are two distinct features. Both of these are a integrated in QEdge QMS. Additionally, QEdge provides powerful tool for converting your DATA into INFORMATION and providing BUSINESS INTELLIGENCE (BI)
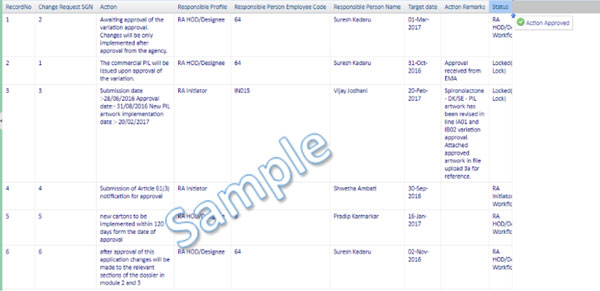
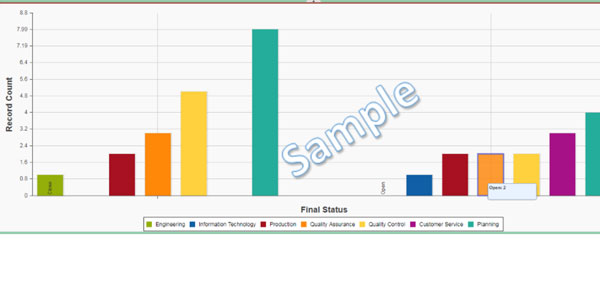
These days, data generated is huge but the challenge lies is reading that data well and making accurate decisions looking at the insights. To cater to such a critical part, we need visual representation of data through which right analysis is displayed to the viewer. Each insight can have a different visual set. With QEdge user can access various user defined reports, sort/filter data, view and download real time reporting data through custom reports. User can also view graphical outputs and trending of this reports for real time analysis and triggers quick decision making.
Users can customize reports using intuitive drag & drop interface, without any technical knowledge. This will help business users to create reports and trending they need, on their own, without depending on IT.
System provides real time live data access. Moreover, you can view reports and graphs which anywhere and anytime providing real-time live data access.
QEdge custom reports and graphs with real time reporting caters to strategic, tactical and operational needs of organizations. To compete with todays global competitive business, our solution provides a platform for complete, comprehensive performance management for today’s global, competitive businesses.
Sample Real Time Reporting: